updated 2000.11.30
Author Janez Puhan
Spectrum Analyzer
The circuit
Arbitrary periodic waveforms are composed of a fundamental sinusoidal wave and related harmonics. Square wave for example can be synthesised from sine waves. Here, the opposite procedure will be sketched out.
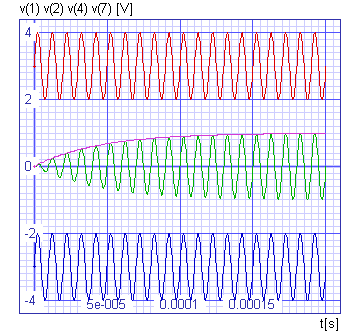
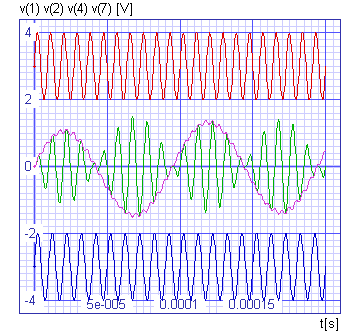
Fourier analysis amplitudes of the fundamental waveform and related harmonics can be found by multiplying the waveform under test by a searching sine wave. The instantaneous products will be continuously averaged. If both waveforms are equal in phase and frequency, a good correlation will exist and the multiplication will produce only positive products. These are then smoothed out and summed up by an integrator. If both waveforms are different in phase and frequency, the correlation will be poor and the positive and negative outputs at node 5 will be averaged to zero. The uniformly searching sine wave at node 4 appears as a copy of the respective harmonic at node 2. When the amplitude of the waveform under test is changing, the amplitude at node 2 follows with a lag depending on the time constant r1 * c1. Selectivity of the analyser improves with the time constant, but the transient response will then be slowed down.

The input file
spectrum analyzer

.control
* 100kHz at input1
tran 400ns 200us 0 400ns
plot v(1)+3 v(2) v(4)-3 v(7) xlabel t[s] ylabel 'v(1) v(2) v(4) v(7) [V]'
  + title 'TRAN analysis at 100kHz'
* switching to 110kHz
alter v3 dc = 0
* 110kHz at input1
tran 400ns 200us 0 400ns
plot v(1)+3 v(2)*4 v(4)-3 v(7)*4 xlabel t[s] ylabel 'v(1) v(2) v(4) v(7) [V]'
  + title 'TRAN analysis at 110kHz'
.endc

v1 8 0 dc 0 sin 0 1V 100kHz
v2 9 0 dc 0 sin 0 1V 110kHz
v3 10 0 dc 1
v4 4 0 dc 0 sin 0 1V 100kHz

e1 3 0 2 1 1
eint 7 0 0 6 1meg

b1 1 0 v = v(10) * v(8) + (1 - v(10)) * v(9)
b2 5 0 v = v(3) * v(4)
b3 2 0 v = v(4) * v(7)

r1 5 6 22k
r2 4 0 1g
r3 1 0 1g
r5 2 0 1g
r6 3 0 1g

c1 6 7 1nF

.end
The results

